May 19, 2022 | Science | Source |
Introduction: Multispecies tree planting, where different tree species are planted together, has been used in forestry to enhance timber production and ecosystem services. However, a comprehensive assessment of its effectiveness was previously lacking. By using data from both single-species and multispecies plantations, an international research team led by Peking University and Yunnan University in China evaluates how multispecies planting affects tree growth.
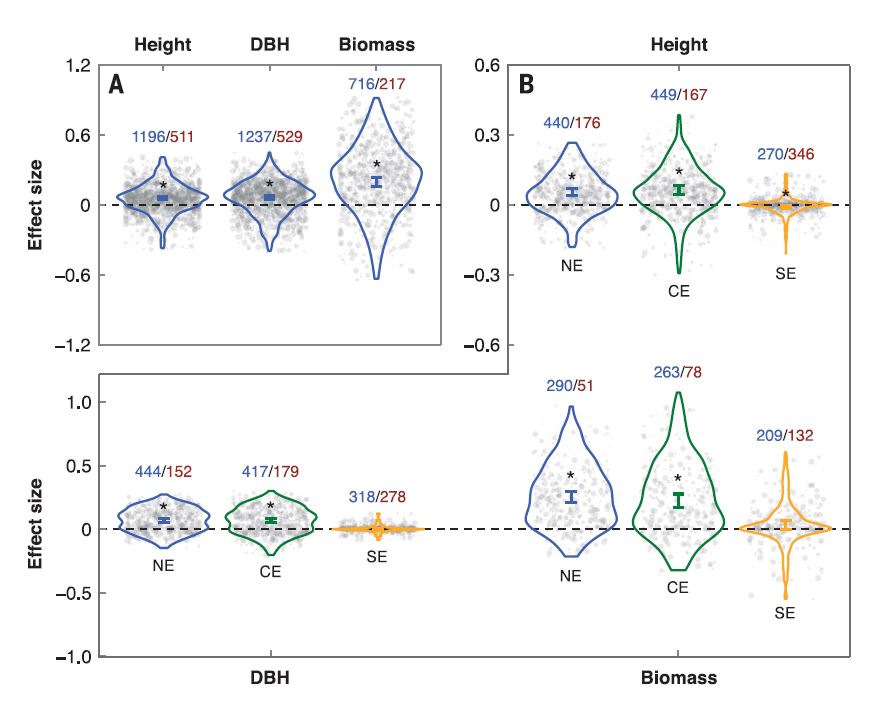
Key findings: The study found that multispecies plantations resulted in higher average tree height, diameter, and biomass compared to single-species stands. Specifically, tree height was 5.4% higher, diameter was 6.8% larger, and aboveground biomass was 25.5% greater in multispecies stands. These improvements are primarily due to the complementary interactions between different tree species, such as variations in leaf morphology and lifespan, stand age, planting density, and temperature.
The results suggest that multispecies planting not only boosts tree growth and biomass but also contributes positively to afforestation and reforestation strategies. This approach can be beneficial for restoring degraded land, providing ecosystem services, and mitigating climate change. While monocultures might be simpler and cheaper to manage, multispecies plantations offer greater long-term benefits in productivity and ecosystem health. Therefore, it is recommended to consider multispecies planting in forestry practices to optimize the environmental and economic benefits of forest management.
Figure | Effect sizes of species mixing on height, DBH, and aboveground biomass. (A) Effect sizes at the species level. (B) Effect sizes at the whole-stand level. In (B), net effect (NE), complementarity effect (CE), and selection effect (SE) are shown in blue, green, and yellow colors, respectively. Gray bubbles show the original sample effect size, and the two numbers above each subset graph indicate the number of samples with effect sizes greater than (blue) or smaller than (red) zero. The colored bars represent the 95% confidence intervals of mean effect size across samples. *P < 0.05.


