September 1, 2024 | Energy Nexus | Source |
Introduction: In China, the fishery-photovoltaic complementary industry (FPCI, also known as aquavoltaics) merges aquaculture with solar energy by installing photovoltaic (PV) panels over fish ponds, allowing for fish farming while generating electricity. Despite its rapid growth, the development model lacks comprehensive scientific data. The study led by researchers from Fudan University in China and working partners reviewed the industry's development, environmental and economic impacts, and challenges to provide insights for sustainable advancement.
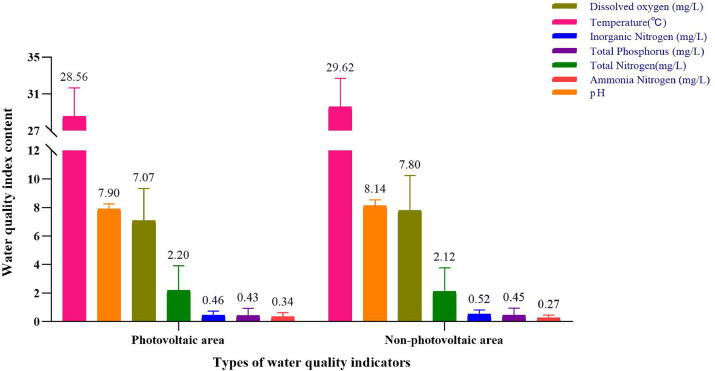
Key findings: This review shows that FPCI projects are primarily located in the Yangtze River and Pearl River Basins, chosen more for their suitability for aquaculture than for solar energy potential. The shading from PV panels during summer slightly reduces water quality, including minor decreases in pH, water temperature, and dissolved oxygen. Conversely, levels of total nitrogen and ammonia nitrogen increase moderately. Zooplankton biomass generally decreases, although effects on species diversity vary by ecosystem. The shading benefits fish species that thrive in lower light conditions, potentially helping maintain fishery yields.
The model significantly reduces CO2 emission per megawatt of power generated, with the average of 978.6 tons CO2 emission per megawatt per year. The land requirement and land-use conflict are also reduced, 1.64 hectares of land is required per megawatt of power generation, compared to 3.66 hectares per megawatt in the case of land-mounted solar farms.
Economically, while there are challenges related to initial costs and long payback periods, the overall feasibility is promising with government support and technological advancements. Future research should focus on life cycle assessments, improved PV technology, and optimized aquaculture practices to enhance both environmental and economic benefits.

Figure | Comparison of average water quality indicators between PA and NPA in each case.


