June 15, 2023 | Nature Food
A research team from the Netherlands, China, and the UK delves into the complex relationship between food consumption and greenhouse gas (GHG) emissions on a global scale. Traditional measures of GHG emissions tend to focus on production within a country's borders, but this study takes a broader perspective by considering the emissions associated with international trade in food.
The researchers analyzed data from 2000 to 2019 to assess the GHG emissions resulting from global food consumption. They used a unique approach that tracks the physical flow of traded goods and employs structural decomposition analysis to uncover the underlying drivers of emissions. What they found is that in 2019, GHG emissions linked to the global food supply chain accounted for a significant 30 ±9% of all human-caused GHG emissions.
Interestingly, the main culprits driving this increase in emissions were the rising consumption of beef and dairy products in rapidly developing countries. In contrast, developed countries with a higher proportion of animal-based foods witnessed a decrease in per capita emissions.
A notable trend identified in the study was the outsourcing of emissions through international food trade, particularly in beef and oil crops, which collectively contributed to an increase of approximately 1 gigaton of CO2 equivalent emissions. This uptick was largely due to developing countries ramping up their food imports.
The study also highlights that two primary factors led to the overall rise in global emissions: population growth (+30%) and an increase in per capita food demand (+19%). Fortunately, emissions intensity from land-use activities decreased substantially (-39%), helping to offset some of the emissions growth.
In conclusion, the findings underscore the critical role of consumer and producer choices in mitigating climate change. To effectively reduce emissions, there is a need to incentivize the adoption of less emissions-intensive food products.
Read more: Changes in global food consumption increase GHG emissions despite efficiency gains along global supply chains
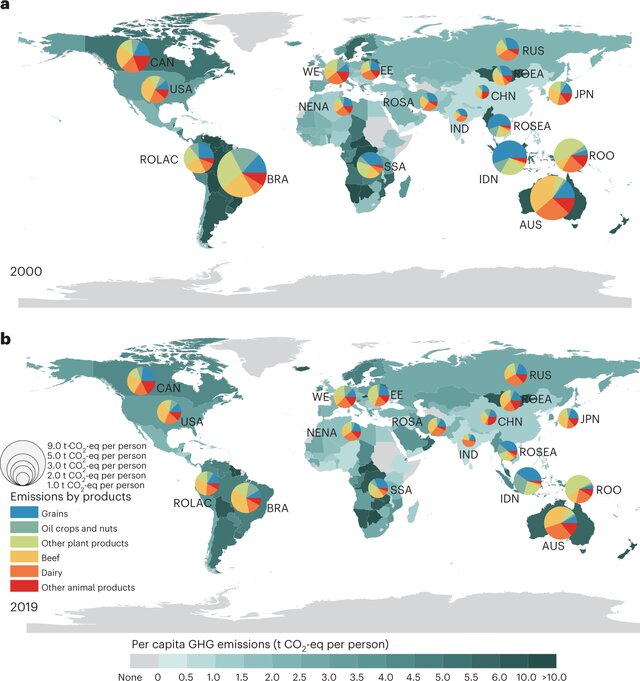
Fig 2. Per capita GHG emissions of food consumption by country in 2000 and 2019 a, b. The background map shows the level of per capita consumption-based emissions at the country scale in 2000 (a) and 2019 (b). The pie chart shows the fraction of average consumption-based emissions of animal-based and plant-based food products per person in 2000 (a) and 2019 (b), and the size represents per capita emissions of 18 countries/regions.


