November 13, 2024 | Nature | Source |
Introduction: Researchers from Shandong University (China) and the University of Maryland (USA) investigate the global distribution of environmental footprints across 168 countries, covering 98% of the global population. The study categorizes 201 global consumption groups by expenditure using the environmentally extended multi-regional input-output (EE-MRIO) model. This model estimates direct and indirect environmental impacts of consumption, quantifying six environmental indicators tied to planetary boundary (PB) transgressions, including CO2 emissions, land-system change, nitrogen fixation, phosphorus fertilizer use, blue-water consumption, and biosphere integrity. By addressing consumption inequality, the research aims to guide sustainable policymaking to restore ecological balance.
Key findings: The study reveals that the top 10% of global consumers are disproportionately responsible for 43% of CO2 emissions, 23% of land-system changes (HANPP), 26% of nitrogen fixation, and 25% of phosphorus use, alongside significant contributions to blue-water consumption and biosphere degradation. In contrast, the bottom 50% largely remain within planetary boundaries. Key drivers include food production, manufacturing, and services. Wealthier groups rely more on animal-based foods, while poorer groups depend on plant-based diets. Mitigation strategies aimed at reducing overconsumption among the wealthiest 20%, particularly in food and service sectors, could decrease environmental pressure by 25–53%, helping restore ecological balance and biodiversity.
Targeted policies, such as progressive taxation, efficiency improvements, and equitable resource distribution, are essential to curb overconsumption and promote sustainability. However, data gaps and socioeconomic disparities pose challenges for universal implementation. Future research should broaden planetary boundary indicators, improve data tracking, and foster collaboration between governments, industries, and communities to enhance global sustainable practices.
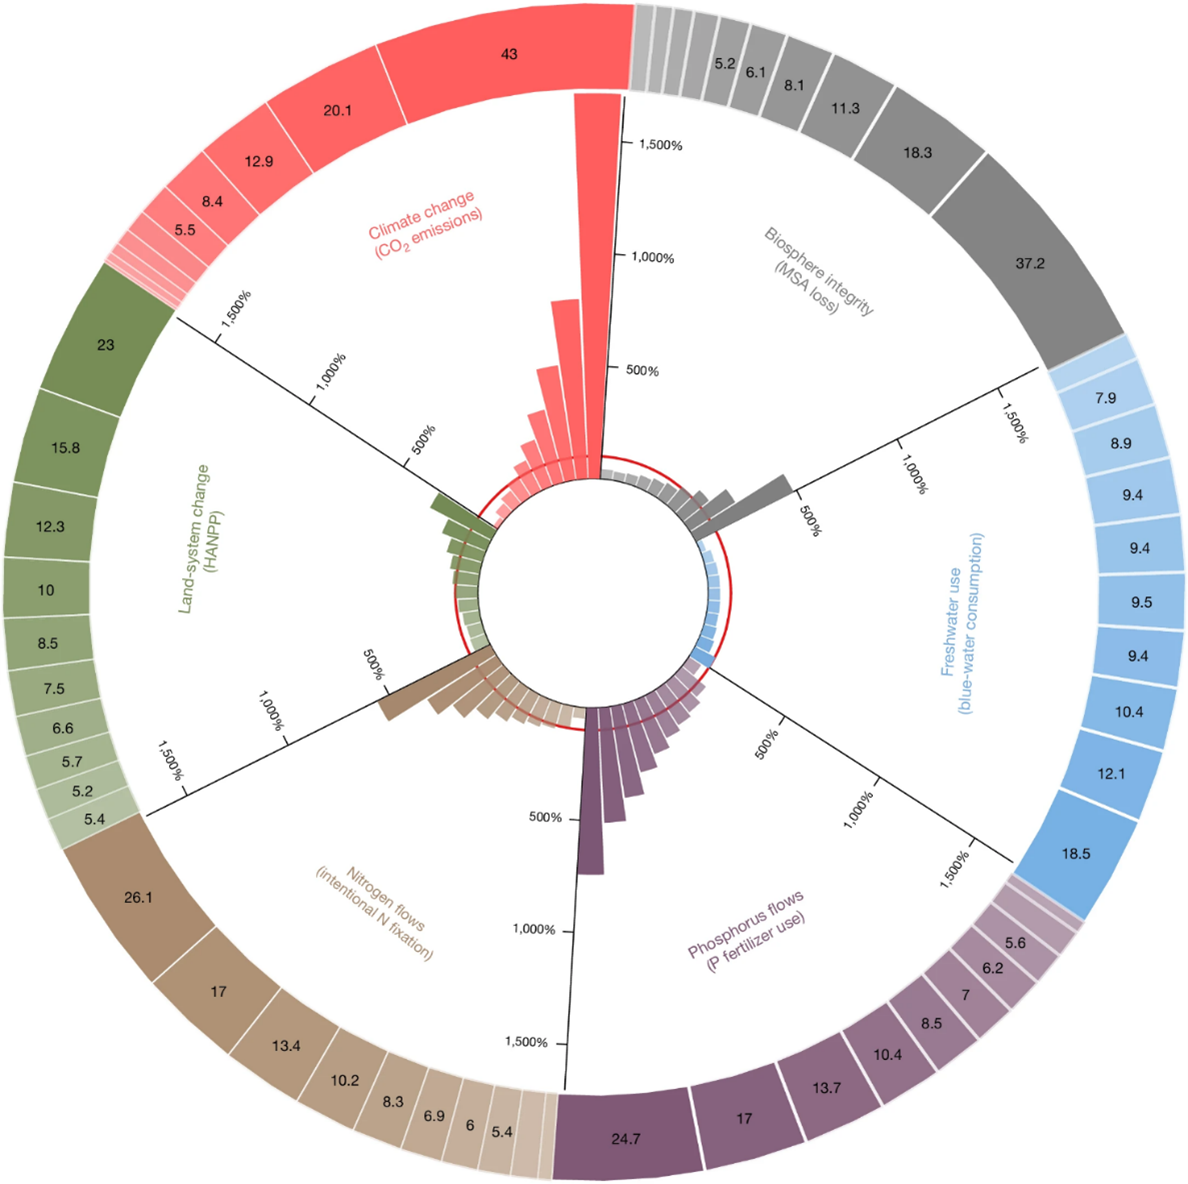
Figure | The footprints of the six environmental indicators and the shares of each global expenditure decile in the total footprints in 2017. Bar and doughnut pie chart refers to the per capita footprints and the percentage share of each global decile in the total footprints, respectively. The expenditure level of each decile group increases as the colour deepens. The red circle represents the level of per capita boundaries.


