March 13, 2023 | Nature Food | Source |
Introduction: Food loss and waste (FLW) are major contributors to global GHG emissions, yet their full impact across the food system has been underexplored. A research team led by Nanjing Forestry University in China, alongside partner institutions in Singapore, conducted a cradle-to-grave analysis quantifying both supply-embodied (∑FLWCS) and waste-management-related (∑FLWCT) FLW emissions. Using material balance modeling and life cycle assessment, the study also evaluated the potential of various policy and technological interventions to reduce emissions.
Key findings: In 2017, global FLW accounted for 9.3 Gt COŌéée—half of total food system emissions. Emissions from meat and animal products dominated supply chain emissions (73.4%), particularly in regions with high meat consumption such as North America, Europe, and Oceania, where meat-related FLW accounted for over 85% of supply-embodied emissions. Meanwhile, cereals and pulses were the primary drivers of waste-management emissions due to their high carbohydrate content, especially in Sub-Saharan Africa (75.1%), Central and Southern Asia (69.3%), and Eastern and Southeastern Asia (67.5%). These patterns underscore the influence of regional dietary preferences on emissions and the importance of tailored mitigation strategies. Notably, the consumer stage alone contributed 35.5% of supply-embodied emissions—more than wholesale, retail, and traders combined—highlighting a critical area for behavioral and policy intervention.
Waste-management emissions showed a negative correlation with GDP per capita in developed regions, suggesting that economic development often enables the adoption of more environmentally friendly waste treatment technologies. Conversely, supply-embodied and food logistics emissions correlated positively with GDP, driven by the extended and complex supply chains associated with international food trade, as well as more intricate transportation and processing infrastructure. Halving FLW generation and meat consumption could reduce emissions by 25% and 23%, respectively. If combined, they could cut emissions by 42.8%, despite a potential trade-off of 2.4% increase in waste-related emissions due to shifts toward plant-based foods. Enhancing anaerobic digestion and composting could further reduce waste emissions by 14%. The study highlights the need for region-specific, integrated strategies to optimize mitigation benefits.
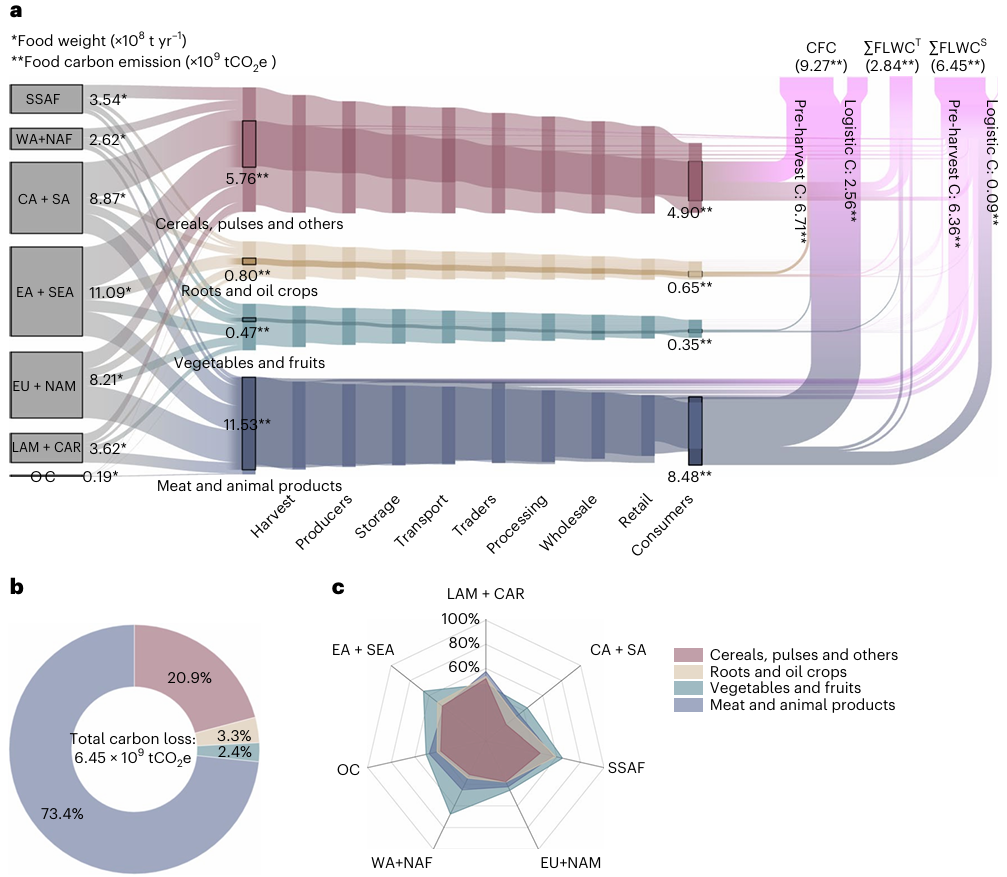
Figure | Food and GHG flows of the global food system in 2017. a, Food and GHG flows among seven geographical regions and four food categories. b, Supply embodied FLW GHG emissions from food categories. c, The proportions (%) of FLW in geographical regions. The food supply data were obtained from Food and Agriculture Organization (FAO) Statistical Databases (FAOSTAT); the geographical regions are classified under the Standard Country or Area Codes for Statistical Use (known as M49) of the United Nations Statistics Division, which include (1) Sub-Saharan Africa (SSAF) (n = 39 countries), (2) Western Asia and Northern Africa (WA + NAF) (n = 19), (3) Central Asia and Southern Asia (CA + SA) (n = 13), (4) Eastern Asia and South-eastern Asia (EA + SEA) (n = 17), (5) Europe and Northern America (EU + NAM) (n = 41), (6) Latin America and the Caribbean (LAM + CAR) (n = 33), and (7) Oceania (OC) (n = 2), with their abbreviations shown in the first column in a. Logistic C, GHG emissions from all the logistic activities incurred in the eight post-farming stages from harvest to retail, under the domains of CFC and ∑FLWCS; pre-harvest C, GHG emissions from crop cultivation or livestock breeding stages.


