October 12, 2020 | Nature Sustainability |
Introduction: An international research team led by researchers from the International Food Policy Research Institute (IFPRI), in collaboration with multilateral and academic institutions across Europe, Africa, and Latin America, conducted a global scoping review to examine how incentive programs (market- and non-market-based, regulatory, and cross-compliance) affect sustainable agricultural practices (SAPs) adoption and environmental and economic outcomes, including productivity, profitability, and environmental sustainability. The study screened evidence from nearly 18,000 papers published between 2000 and 2019 and synthesized findings across incentive types and regional contexts.
Key findings: Across incentive types, programs linked to short-term economic benefits tend to achieve higher initial adoption than those focused mainly on ecological services. However, the review emphasizes that long-term adoption and maintenance depend most strongly on farmers’ perceived benefits for their farm, the environment, or both, underscoring the limits of payment-driven approaches. The review also highlights the complementary role of technical assistance and extension services across all incentive mechanisms. Advisory support significantly improves adoption and long-term persistence, particularly for regulatory and cross-compliance incentives, where knowledge and compliance costs are higher. Evidence suggests that technical assistance helps sustain practices beyond the duration of incentive payments.
Methodological limitations remain substantial. The authors report no randomized controlled trials (RCTs) in the reviewed literature, constraining causal inference. Evidence on environmental outcomes is especially weak, with most studies relying on farmers’ perceived improvements rather than systematic quantitative measurement. Finally, the review identifies a key policy trade-off: targeting wealthier landholders often delivers higher environmental efficiency due to lower opportunity costs, but risks excluding poorer farmers and widening income inequalities, creating tension between environmental effectiveness and social equity.
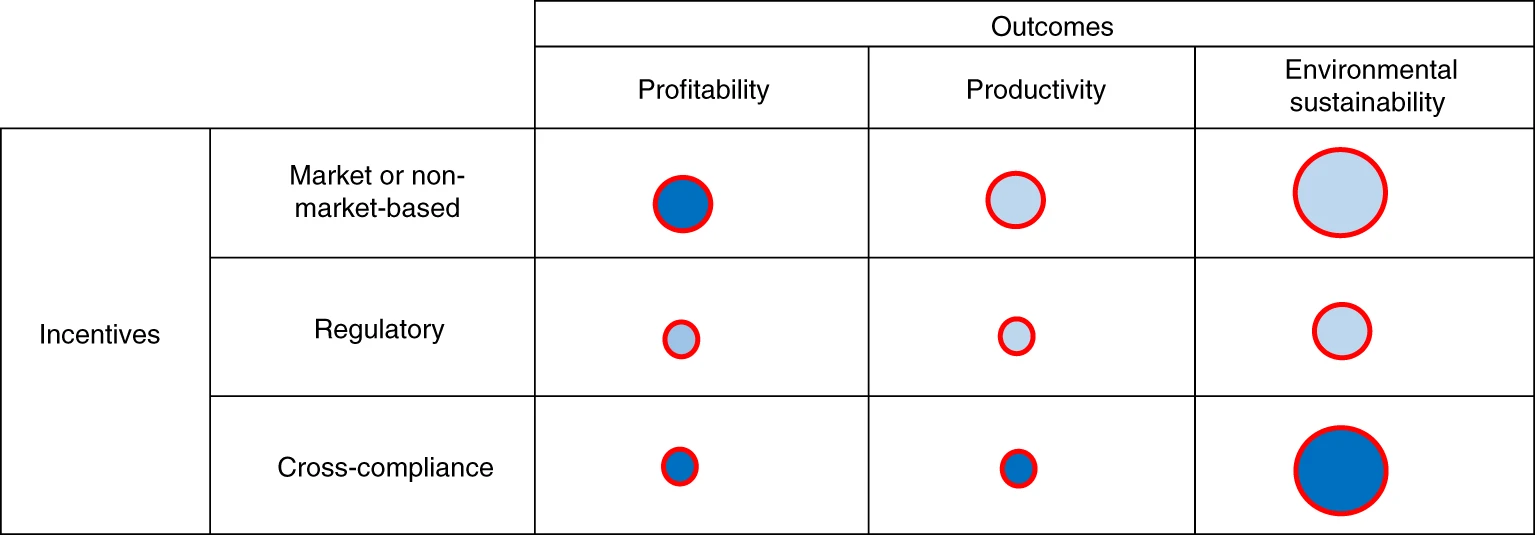
Figure | Evidence map. The map shows articles reviewed by intervention and outcomes (subset of 44 articles). The sizes of the circles correspond to the number of reviews in each category. The fill colours indicate the level of evidence, with dark blue representing strong evidence and light blue representing weak evidence. The border colors indicate the quality of the methodology; red is used for methodologies that are generally strong and yellow where there are concerns over the methodologies.


