November 30, 2021 | Nature Communications |
Introduction: Efforts to reduce local pollutant and GHG emissions have been significant, but in our globalized world, agricultural production is intertwined with international trade to meet global food demands. A substantial portion of emissions is linked to this trade, mainly from developing countries to meet developed nations' needs. Understanding these emissions' global transfer can significantly help reduce them. By analyzing global trade networks, principal researchers from Beihang University and Nanjing University of Information Science and Technology in China team up with researchers from US, UK, and Italy to quantify ammonia emission transfer associated with international trade.
Key findings: A significant portion of global agricultural ammonia (NH3) emissions in 2012 are linked to international trade. These emissions contribute to 61 thousand premature deaths related to PM2.5 pollution, with crop cultivation and livestock production accounting for 25 thousand and 36 thousand deaths respectively. The trade-related health impact forms a network divided into three trading communities. Cooperation within these communities could lead to substantial NH3 emission reductions through technological advancements and trade structure adjustments. Identifying regional communities through network analysis provides a fresh approach to addressing NH3 emissions, applicable to mitigating agricultural greenhouse gas emissions as well.
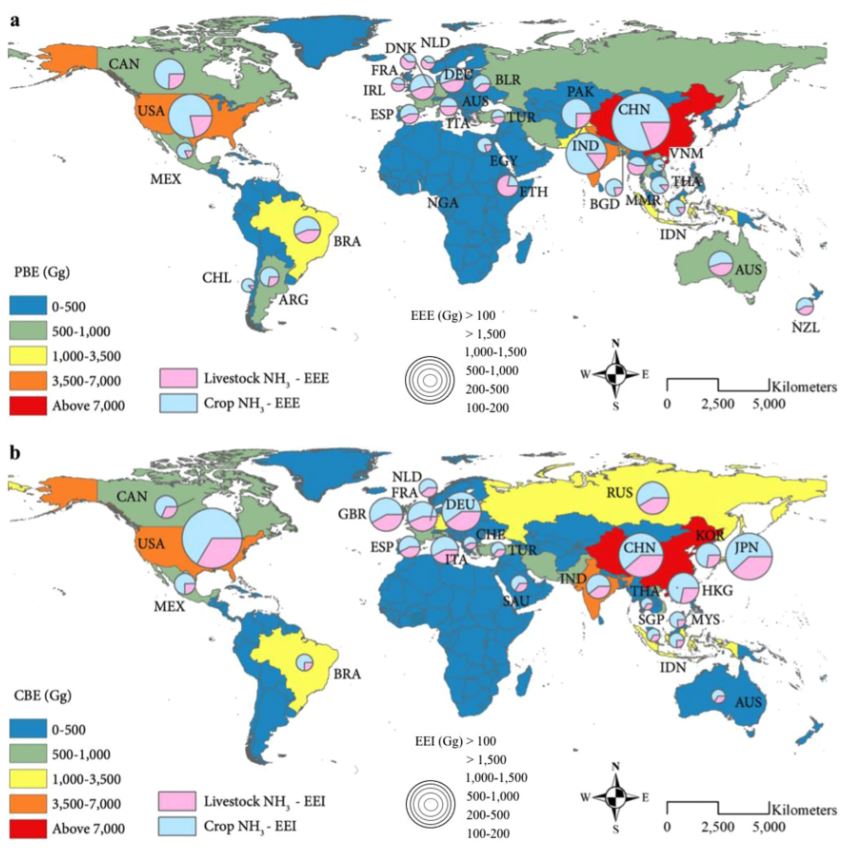
Fig. | Global agricultural NH3 emissions associated with production, consumption, and trade. a Production-based emissions (PBEs) of NH3 (shaded) and export-related emissions (EEEs) of NH3 (pie charts) (Gg) in 2012. Pie charts inserted in (a) are the countries (highlighted by country’s abbreviation) with high EEE NH3 emissions from livestock and crop cultivation, respectively. b Consumption-based (CBE) and import-related emissions (EEIs) of NH3 (Gg) in 2012. Detailed results for each country are provided in the Supplementary Data files. The three-letter country abbreviations inserted in the plot are detailed in Supplementary Data 6. Maps were created by using ArcGIS version 10.7.1 (ESRI https://www.esri.com/en-us/arcgis/about-arcgis/overview).


