January 04, 2023 | Nature |
Introduction: Croplands globally serve as a significant contributor to nitrogen pollution, posing a formidable challenge due to its non-point-source nature and various constraints hindering pollution-reduction efforts. A Chinese research team led by Zhejiang University in China, with the help of collaborators from Australia, Austria, Netherlands, Germany, and UK, has reviewed 1,521 field observations worldwide to identify measures for controlling nitrogen pollution.
Key findings: The research has identified 11 key measures capable of curbing nitrogen losses from croplands by 30–70%, while simultaneously boosting crop yield and nitrogen use efficiency by 10–30% and 10–80%, respectively. Implementing this comprehensive set of measures on a global scale could yield remarkable results: producing 20% more crop nitrogen, while using 21% less nitrogen fertilizer and emitting 32% less nitrogen pollution by 2015 standards. Moreover, the societal benefits are substantial, estimated at 476 ± 123 billion US dollars, outweighing the mitigation costs (19 ± 5 billion USD). Notably, significant economic gains stem from reduced premature mortality, primarily by averting respiratory diseases due to PM2.5 pollution, alongside preservation of ecosystem services. Climate impacts, although minimal at −2 ± 1 billion USD, underscore the importance of considering potential drawbacks in improved cropland nitrogen management. Innovative policies like a nitrogen credit system could play a pivotal role in promoting and subsidizing the adoption of these measures, thus ushering in a more sustainable future for global agriculture. However, improved cropland nitrogen management could possibly affect carbon sequestration and exacerbating global warming in some regions (Read more).
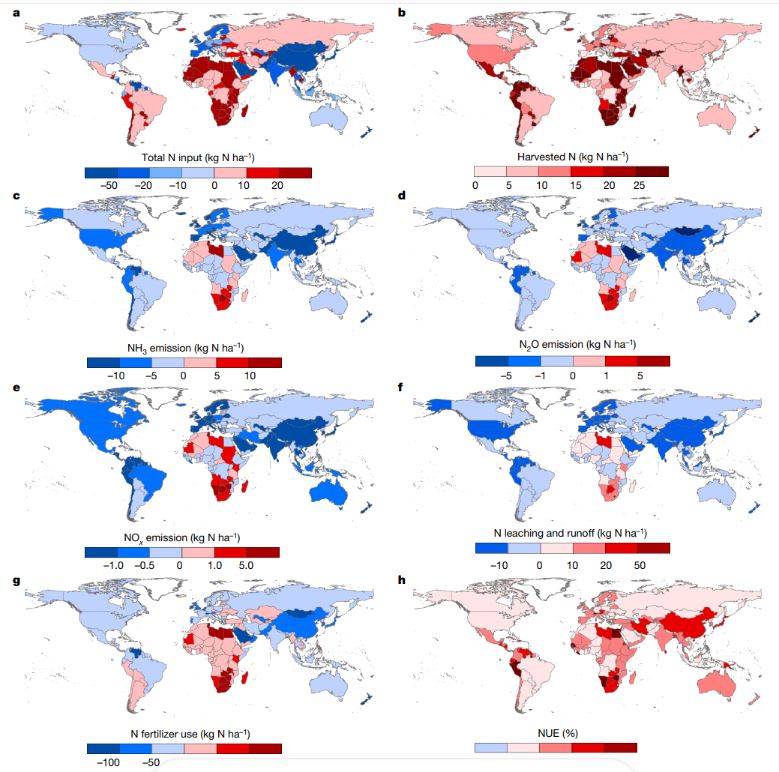
Figure | Changes in global N budget in croplands with the best adoption of the 11 selected measures. a, Total N input. b, Harvested N. c, NH3 emission. D, N2O emission. E, Nox emission. F, N leaching and runoff. G, N fertilizer use. H, NUE. The base year is 2015 and the changes are calculated on the basis of the differences between the N fluxes in 2015 before and after the implementation of the most appropriate set of measures at the national level. The changes in NUE are in percentage points; for instance, the NUE increased by 17 percentage points in China. The base map is applied without endorsement from GADM data (https://gadm.org/).


