March 08, 2021 | Nature Food | Source |
Introduction: European Commission Joint Research Centre has developed a new global food emissions database, EDGAR-FOOD, which estimates greenhouse gas (GHG) emissions related to the global food system for the years 1990–2015. Building upon the Emissions Database of Global Atmospheric Research (EDGAR) and incorporating land use/land-use change emissions from the FAOSTAT emissions database, EDGAR-FOOD offers a comprehensive and consistent dataset of GHG emissions throughout the entire food supply chain, including production, processing, transport, and consumption.
Key findings
- Contribution of Food System to GHG Emissions: In 2015, the food system was responsible for 34% of total anthropogenic GHG emissions globally, with emissions estimated at 18 Gt CO2e yr−1. Developing countries emitted 73% of these emissions, while industrialized countries emitted 27%.
- Emission Sources: The largest fraction of GHG emissions from the food system came from the land-based sector, including agriculture and associated land-use change activities, accounting for 71% of global food-system emissions. Industrialized countries had larger contributions from downstream energy-related sectors like industry and waste.
- Top Emitting Economies: Six top emitting economies (China, Indonesia, United States, Brazil, European Union, and India) contributed over 51% of global food-system emissions in 2015.
- Temporal Trends: While food-system GHG emissions increased from 1990 to 2015, the share of total GHG emissions decreased over time. Global food production increased, indicating a decrease in emission intensity.
- Emissions from LULUC: Almost one-third of food-system emissions came from land use/ land-use change activities associated with agricultural production, mainly from carbon losses due to deforestation and degradation of organic soils.
- Energy Use in the Food System: About a third of food-system emissions came from energy-related activities. Production stages, including agriculture and inputs like fertilizers, contributed the most to emissions.
- Emission Gases: Methane (CH4) emissions accounted for a significant portion of food-system GHG emissions, mainly from livestock production, farming, and waste treatment.
- Per Capita Emissions: Per capita food-related emissions decreased from 1990 to 2015, with an average of 2.4 t CO2e per person in 2015.
- Distribution and Packaging: Packaging had the highest emissions among food distribution activities. Transportation contributed about 4.8% to food-system GHG emissions.
- Regional Variation: The share of food-system GHG emissions varied across countries and regions, influenced by factors such as agricultural practices, economic structure, and land use.
- Policy Implications: Effective mitigation strategies for reducing food-system emissions need to address both production and consumption aspects and consider regional differences.
In conclusion, the food system plays a significant role in global GHG emissions, with various sectors and activities contributing to emissions. Understanding these dynamics is crucial for designing effective mitigation strategies to address climate change.
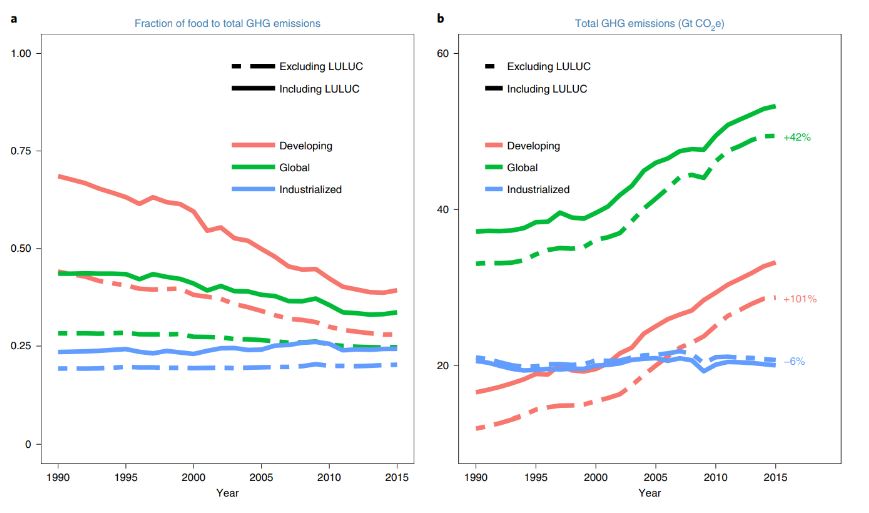
Figure | Total GHG emissions and food-system data globally, and in developing and industrialized countries. a,b Fraction of food to total GHG emissions (a) and total GHG emissions from the food system (b) globally, in developing and industrialized countries. Non-CO2 GHG emissions (CH4, N2O and F-gases) are expressed as CO2 equivalent (CO2e) calculated using the GWP100 values used in the IPCC AR5, with a value of 28 for CH4 and 265 for N2O.


