August 16, 2023 | Nature
Introduction: Freshwater ecosystems, contributing half of global CH4 emissions, lack clear understanding of rivers and streams' role. Current estimates face extreme variability, requiring a comprehensive approach. Leveraging a vast CH4 database, research team from Umeå University in Sweden collaborated with researchers from US and Canada in utilizing machine learning to model global CH4 concentrations and emissions from rivers, addressing uncertainties and identifying key drivers for improved predictions and understanding of carbon dynamics in response to environmental changes, such as downstream of agricultural farms.
Key Findings: The research reveals that the highest concentrations of CH4 are found in tropical regions like Southeast Asia and the Amazon, as well as in Arctic and boreal areas such as Fennoscandia and Alaska. This seemingly contradictory distribution is explained by the conditions favoring CH4 production in both warm and cold environments, such as water-saturated soils with large organic matter stores. The research identifies various climatic, biological, and physical factors that contribute to CH4 concentration at global and local scales, emphasizing the importance of landscape characteristics.
Despite the universal temperature dependence of CH4 emissions observed in freshwater systems, the study finds lower temperature sensitivity in rivers, attributing this to the open nature of running waters with external inputs influencing emissions. Human activities, particularly in densely populated areas, are identified as a significant factor influencing CH4 concentrations, highlighting the role of human-induced modifications in river ecosystems in contributing to greenhouse gas emissions. Overall, the study provides insights into the complex interplay of natural and human-induced factors affecting CH4 levels in global riverine systems, offering valuable information for climate change mitigation efforts.
Read more: Global methane emissions from rivers and streams
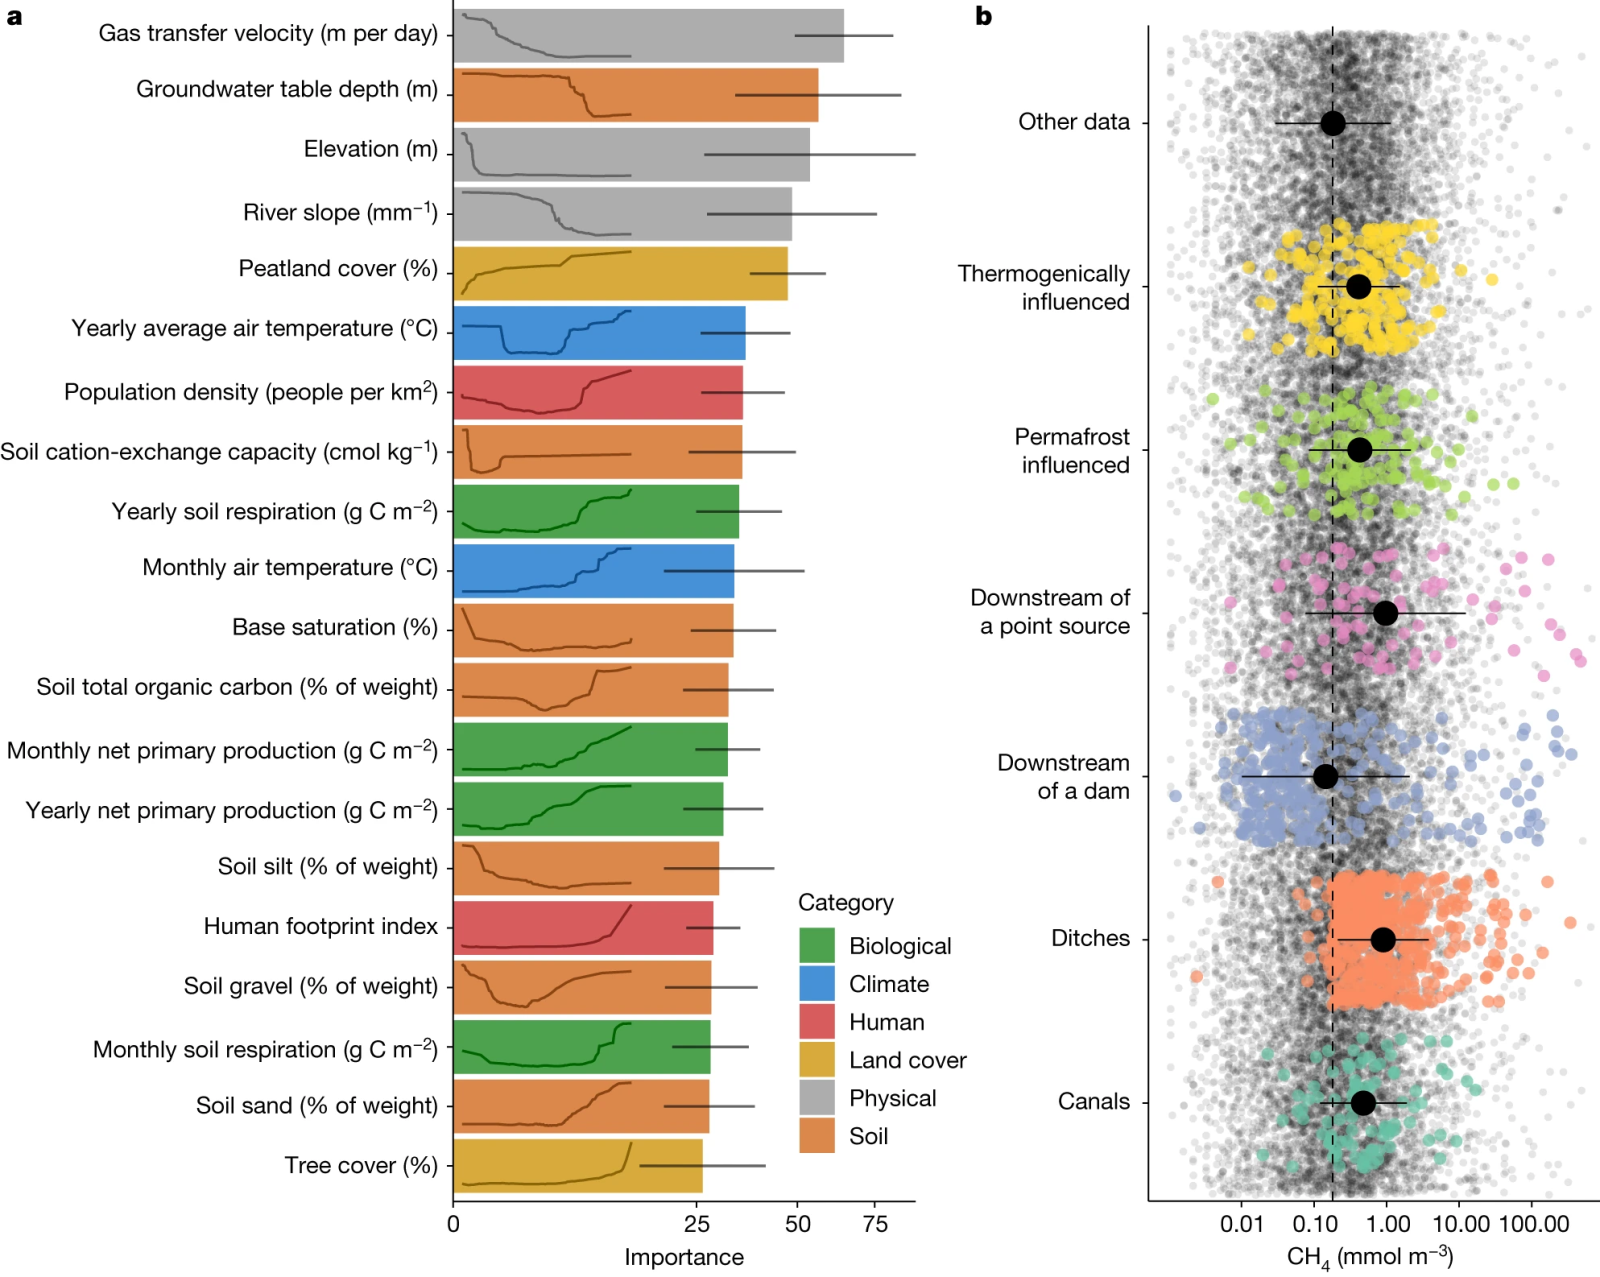
Fig. 2: Main drivers of CH4 concentrations in streams.
a, The 20 most important variables in the random forest model. The x axis shows the median importance across all monthly models (n = 12), with error lines representing standard deviation (s.d.); note the square-root transformation of the x axis. The line inside each bar is the partial dependence, which represents the marginal effect of a given feature (x axis) on predicted CH4 concentrations (y axis). These lines are a simplification of a more detailed version (Supplementary Information). b, CH4 concentrations of some site categories from GRiMeDB13 were excluded from the model as they were not captured in the hydrological model or were targeted observations not representative of catchment properties (Methods). The underlying jittered points represent all other observations in GRiMeDB, with the dashed line representing the average. Each category is colour-coded, with the black dot and a line representing the mean ± s.d.


